This post was written by Deja Bond, the Kathryn Turner Diversity and Technology Intern in the Smithsonian Libraries’ Web Services Department. Deja is an undergraduate Computer Science student at Spelman College. Her work this summer consisted of developing techniques to create data for enhancing the Libraries’ forthcoming Image Gallery re-launch later this year.
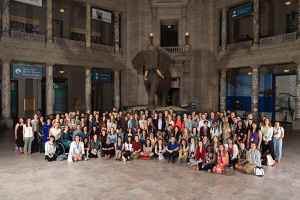
My project was to design and code an algorithm to identify the predominant colors within an image. When someone performs a search in the Image Gallery (an online collection of images from Smithsonian Libraries books, still in beta), they are able to refine their search by subject, creator and publication date. The goal was to add another option for color. The big question was: how would I design and implement an algorithm that would return the predominant colors within an image for over 14,000 images sufficiently?
Before the design of the algorithm, I familiarized myself with not only the images given to me for the project, but with everything that Smithsonian Libraries had to offer. Details and color never mattered so much to me as it did this summer. I questioned everything; is it really blue or is it cyan?
I never could have imagined how much I would learn, especially on a fun project. What is more exciting than color? It is amazing how many colors red, green and blue can produce. It is the amount of red, green and blue within a color in an image that matters. Colors matter. Hues, saturations, and values matter.
After some time, with my eyes closed, I began to enjoy this wonderful play of colors and forms, which really were a pleasure to observe. I could identify the colors within an image with my eye. I think of it this way, if the artist, photographer, etc, took the time to decide which colors to showcase in their work, then the only respectful thing is to attempt to distinguish them. What type of grays are in a black and white image from photographer Thérèse Bonney ?
Since there are many combinations of colors, very often a color might resemble more than one dominant color. When does red end and pink begin? A color may be purple to me, but magenta to you; who is right and who is wrong?
Problems arose, but a computer scientist is a problem solver. I began with research to answer questions like Who has done this before? Is their color search tool successful? Can I learn from their code or algorithm to make a competent algorithm or maybe a better one? My goal was to answer as many of these questions as possible within ten weeks. No pressure.
Computers and Color
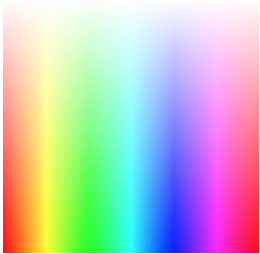
Computers need to quantify colors. The way the human eye views color is through cells on our retina, but computers represent everything as numbers. The most common method to represent colors is to calculate the amount of red, green, and blue needed to produce a desired color. Normally, the values range from 0 to 255 for each of the RGB primaries of the color. For instance, black is represented as (R=0,G=0,B=0) and white as (255,255,255). The combination of these three different colors can provide up to 16,777,216 colors.
In order to more efficiently quantify the colors. I converted the RGB values to HSV values.
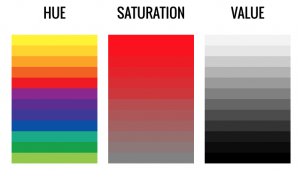
HSV is an acronym. It stands for Hue, Saturation and Value. Hue refers to the dominant wavelength. Saturation refers to the brilliance and intensity of a color. Value defines the darkness or lightness of a color. HSV separates image luminance from color. Hue is a degree from 0˚ to 360˚ (like a color wheel) while saturation and value are percentages from 0% to 100%.We convert RGB values to HSV because it is easier to categorize the values into a color range. For example: A Hue value of 0˚ or 360˚ is red, 22˚ is orange, 63˚ is yellow, 114˚ is green, 242˚ is blue, and so on.
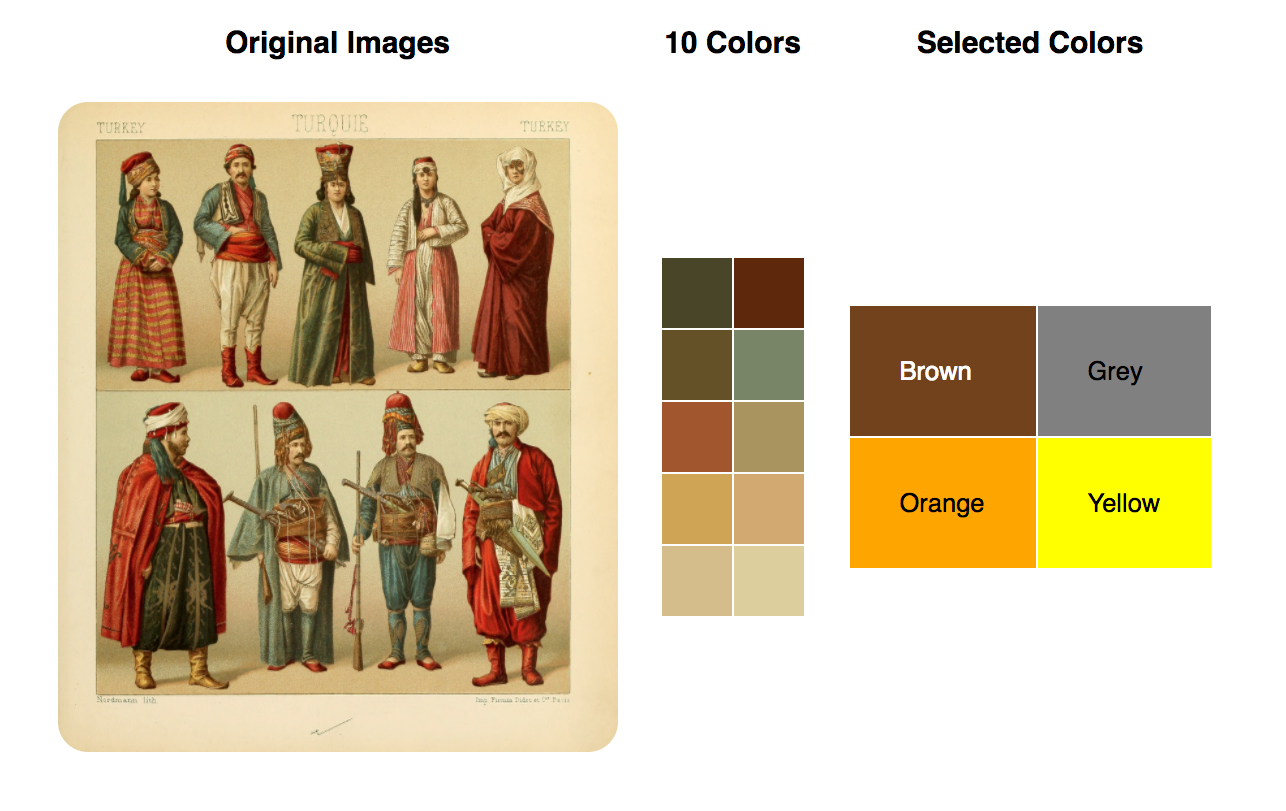
The first step in the algorithm used the ImageMagick tool to identify the ten most predominant colors in the image. We started with one color, but that turned out to almost always be a shade of grey, or an average of all the colors. 20 would give us more colors to choose form, but 10 seemed to be a happy medium.
In my algorithm, these ten colors are passed into a function to place them in an HSV range and returns the dominant color. For example, the Hue for the color White may be anywhere from 0˚ to 360˚, the Saturation can be an integer from only 0 to 9 (very little color), and Value is from 97 to 100 (very bright). When the program receives the RGB values (249, 242, 242) they are translated to HSV (0˚, 3%, 98%). Therefore the function will determine that one of the selected colors in the image is White even if it’s a very light pinkish grey.
Processing a single image was very fast, taking less than a second to identify the predominant primary colors, so we were able to process our test set of 500 images in just a few minutes.
Google API
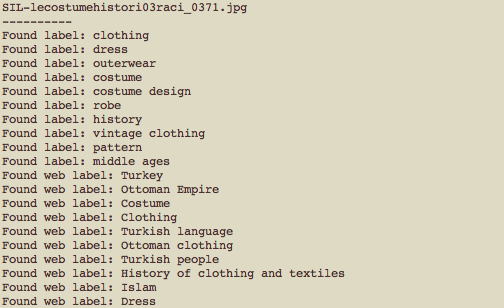
For second part of the project, I added Google’s Cloud Vision API to the code. (API stands for Application Programming Interface.) An API allows the public to have access to another site’s tools for building and expanding software. We used the Google’s Cloud Vision API to give us access to the machine learning data in the Google Images database. The label detection feature detects broad sets of categories within an image, ranging from modes of transportation to animals and more.
After adding the API to the algorithm, we now have access to possible keywords for the images that further aid in searching and filtering.
Summary
This summer internship introduced me to the way in which colors are quantified. Becoming acquainted with the RGB values of colors took some time. The trick is to search for trends within the values. A color will be classified as some shade of grey if all RGB values are equivalent or very close in range. So now, automatically I know that the value (153,153,153) is grey. The value (147,156,162) is also grey, but as one can see, the blue value is the largest out of the three values, hence the resulting color will have blue tint, but it will be faint.
Another challenging part was the implementation of my algorithm. Initially, one would write pseudocode previous to coding. (Pseudocode is a simplified, partially English and partially code outline of a computer program. It is beneficial because helps clarify thoughts, and design a routine well.) Though, I’d written pseudocode, it was still complex. I spent the majority of my time researching new functions, features, and attributes within the Python language and then applying it. The code part softened up for m, when I became better at problem solving. I realized how vital it is to understand an error in the code and then pinpoint the best solution. Studying other coding issues and solutions online really helped me code more smoothly.
I am leaving this internship with a deep exhale knowing that I wrote a Python script that quantifies the colors of an image and is able to detect label annotations. Maybe the next intern for the Web Services department will enhance my code by adding some similar features as seen in Google’s image search. It would be nice to see type added; a type may be a face, clip art, photo, etc.
I am happy that I could contribute to the Smithsonian Libraries. This experience has positively impacted me and I hope that I have impacted the Libraries as well.

Be First to Comment