In celebration of this year’s annual Open Access Week, the Smithsonian Research Online team will be releasing a new dashboard on our statistics page that includes data about the openness of Smithsonian research publications. As the official record of scholarly publications for the Smithsonian Institution, Smithsonian Research Online is in a great position to analyze this data and help the Institution reflect, participate, and learn more about the scholarly output of the Smithsonian research community.
What is Open Access?
In its most broad definition, open access is an effort to make things available to anyone without restrictions, from sharing images with a CC0 license to making sure wilderness is reachable to the public. Smithsonian Open Access is a strong example, with now over three million images online and freely available since its launch in February. Open access in this post is a more specific use of the phrase, describing the ways research publications (specifically journal articles) are made accessible free of charge and open to anyone.
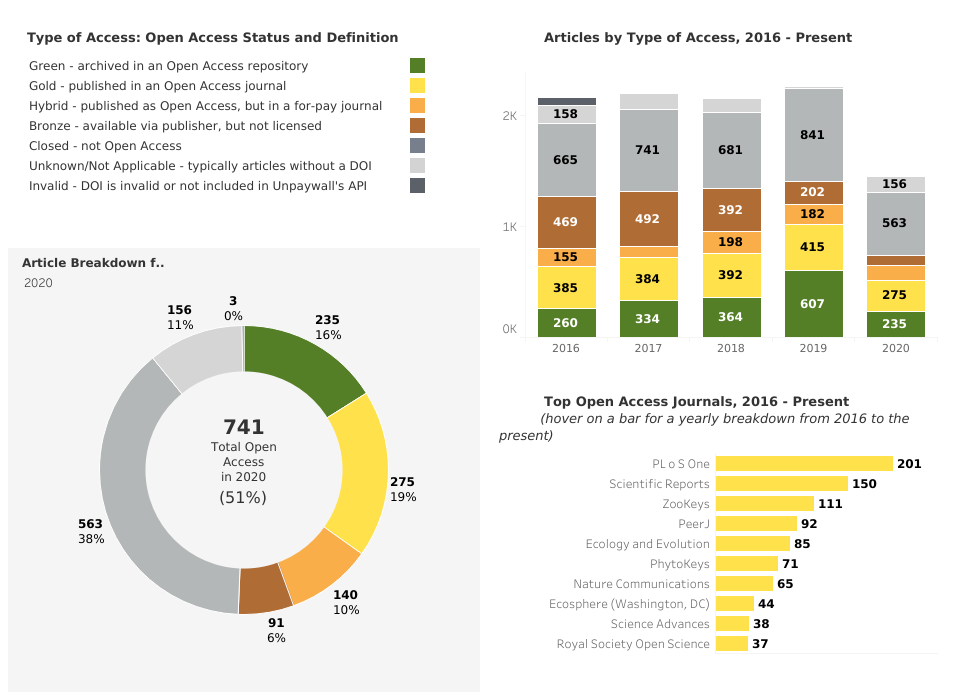
The primary goal of open access is that any reader can access scholarship without paying for articles or having to belong to a library that pays for subscriptions to journals. And as you can see from our dashboard, between 50 and 65 percent of recent Smithsonian-authored journal articles we have tracked in the past few years are in this category. Open access has opened (literally) a world of scholarship to a much broader audience, reducing financial barriers to access academic works.
To authors, librarians, publishers and other actors in the research lifecycle, there is a lot more to open access than just the access part. There are many roads a research article could take to become open. Sometimes, that road involves tolls in the form of article processing fees. These are fees paid by the authors or their institutions to cover the costs of publishing. The economics of open access publishing are a fascinating topic for another time, but suffice it to say, just because an article is free to a reader does not mean there hasn’t been a transaction of money along the way.
Where is the Data From?
Like any kind of analysis, this dashboard required some thinking about data sources. For years, the Directory of Open Access Journals has been a great resource for tracking which journals are open access. More recently, the incredible team at Our Research has launched Unpaywall.org, an open database of over 27 million free scholarly articles. These data sources both have APIs, allowing for quick retrieval of metadata about specific journals and journal articles. Of course, getting a good determination of open access starts with the completeness of our data. We invest in making sure that our metadata has common identifiers like ISSNs for journals and DOIs for articles. These identifiers are the underpinnings of the infrastructure that makes such dashboards possible. To ease an already complicated set of conditions, we went with Unpaywall’s indication of which open access method was “best,” so the dashboard does obscure the fact that an article can be open in more than one way (i.e. you can put an article from an open access journal in a repository, making it both “gold” and “green”).
What do the different types of access mean?
Our colorful categories match those used by Unpaywall.org, with a couple additions:
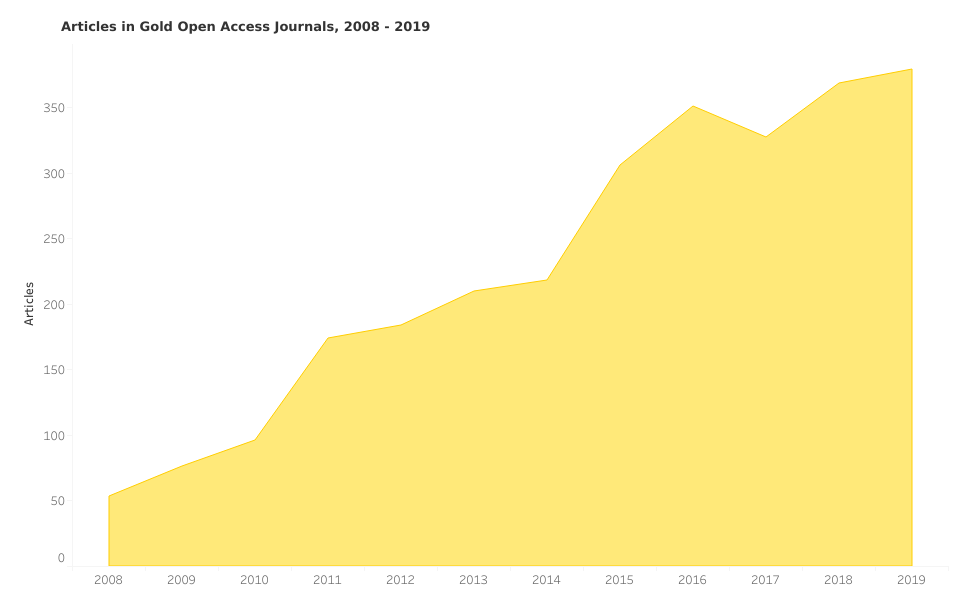
- Gold open access applies to articles published in journals where all content is licensed as open by the journal publisher from the start.
- Hybrid open access occurs when a publisher of an otherwise subscription-only journal makes content available as open access articles.
- Bronze open access is when the articles are available but ambiguous as to whether the content is licensed as open.
- Green open access – the final way – happens when the article has been placed in an open repository.
There are sometimes additional colors thrown into this rainbow, including platinum (meaning the journal is open but the author does not have to submit article processing fees), and black (where otherwise paywall-blocked articles are harvested from publishers and made available in less-than-legal ways). Our dashboard includes a few shades of gray, indicating articles we know are closed, invalid, or unknown. Closed refers to journal articles that are behind paywalls that you or your library pay for, while the latter two are small, but important sets that help us monitor our data health.
Further Explore Open Access
While open access is a global movement, it starts at the local level. We are taking advantage of advancements in the scholarly information infrastructure to enrich our data about what is being published by Smithsonian authors. This helps put us in a unique position to take the pulse on open access scholarship at the Smithsonian. This analysis reveals that a sizable portion of research produced by the Smithsonian is open access, and that this has been increasing as a proportion of all journal articles (though we will give 2020 a big asterisk, given COVID, and that the year is not yet complete).
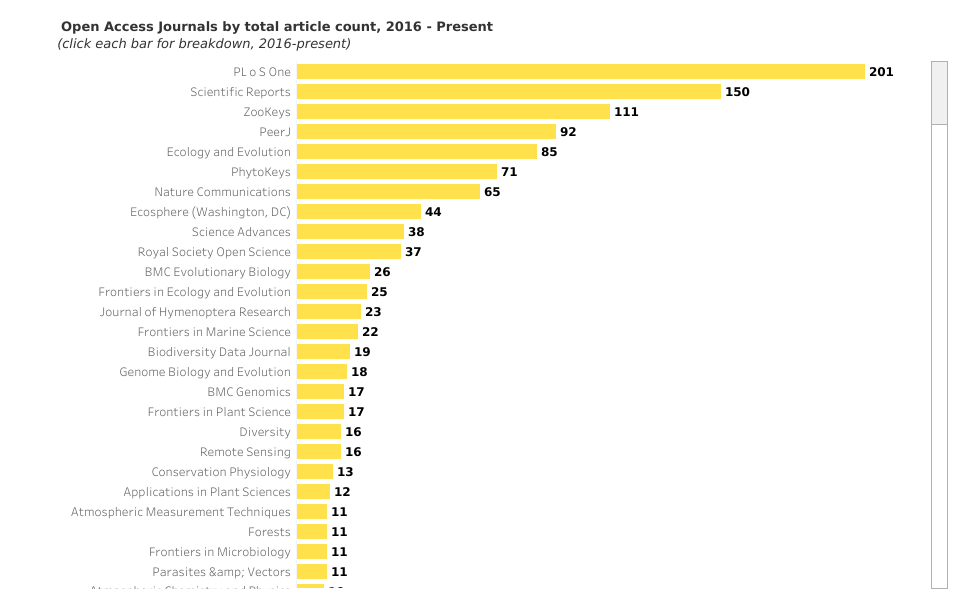
The top open access journals section shows which gold open access journals have the most Smithsonian articles, although drilling down to individual journals often shows a trend downward for many. This could indicate a growing list of gold journal options as the number of gold open access journals increase, or some other trend entirely.
There is plenty more to explore, including putting this dashboard in context with the broader scholarly community. Are the trends we see at the Smithsonian reflected in other scholarly institutions? What further connections or insights do you see from our dashboard? Leave your comments, suggestions, and questions in the comments.
Be First to Comment